Tuesday, January 24, 2017

1/18/17- 1/23/17 Recap

1/23/17: $QCOM gap down ticker on news about Apple's big lawsuit against this company. The float on this stock is bigger than I usually trade at $1.47 billion shares, but I figured I'd give it shot anyway. Got short at VWAP $55.22. No follow through and at 3:30pm my broker cuts my buying power so had to get out at 55.90 for a decent size loss. Oh well ¯\_(ツ)_/¯  live to fight another day.


1/20/17: $BMY gap down on negative news about their cancer treatment drugs. This stock also has a big float of $1.67 billion shares but I kept it on my watchlist anyway. I wasnt patient with the first entry short. then I added again when it popped up towards VWAP my average was now around $50.10. Got spooked when it reclaimed VWAP so I got out for a loss at $50.30. Kept this on watch and re attacked once I saw the stock was starting to break down. Second attempt got short at $50.15 and finally it faded. Locked profits at $49.10.


1/19/17: $NFLX big gap up here. I took a small position since this is a higher priced ticker. Short $140.38 held through the pop and finally faded. Covered all shares at $139.


1/18/17: $CCJ scratch trade here. Was looking at $11.50s on the daily as resistance. Didnt have any patience with my entry and ended up getting out flat.


Sunday, January 15, 2017

12/20/16 and 1/13/17 trades


 12/20/16: $ACAD was a gap up on positive news about their study on this new drug to treat Alzheimers. I try not to read too much into the news, really I just want to know why its moving then I let the chart tell the story. Drowning myself in fundamental analysis is just not as effective for daytrading. Here got short at $29.95 on VWAP rejection and rejection of that $30 level which was support/resistance on the daily chart. Covered all shares at $29.35 really just because it was the friday before the holidays break and I didn't want to leave for vacation on a loser trade so I took my profits and ran lol.


1/13/17: $P pandora radio station gapped up on positive 4th quarter earnings, but this trade was a dud for me and didnt go anywhere. Got long at $12.90 once the break over VWAP was cofirmed and I saw 9ema holding, but didnt have enough range so got stopped out at $12.80. This was the second week of trading for 2017 and still havent had any juicy setups hit my morning scans so hopefully things pick up here going into the third week!


Tuesday, December 20, 2016

12/12/16-12/16/16 Recap

12/13/16: $AKAO long entry at $14.43 once it broke above VWAP. Held through the pullback then sold half the shares at $14.75 and the other half $15.15.


12/15/16: $ATHN had the right read on this just bad timing. Got long at $117 and stopped out at $115.50. Luckily I had super small size on this so loss wasnt too bad. I need to stay more patient at the open and not trade for atleast the first 15 minutes. 


12/15/16: $PIR was from the gap up scanner on good earning estimates. This could have been a easier long than short I just have to make things complicated lol. I was watching this all morning just kept hesitating for an entry thinking it would pull back to VWAP before 11 am. That didn't happen so I stayed patient and  I waited for the backside then got short at $8.69 once I saw price action weakening and approaching VWAP. Got out at $8.45 since my broker reduces my buying power at 3:30pm and it was getting close to that time. 


Monday, December 12, 2016

12/5/16-12/9/16 Recap

Wednesday 12/7/16: $WDC from gap up scanner.Had a nice short entry here at $67.41 and exit at $66.88 for the first trade but then I started chasing. Second short entry was at $66.70, which was horrible, I should know better than shorting into weakness like that. The stock rebounded and I tried to get my average cost of shares down with another short entry off VWAP at $66.92. Got stopped out at 67.30. This is how you turn a $200+ winner into a $50 winner. I guess green is still green. 


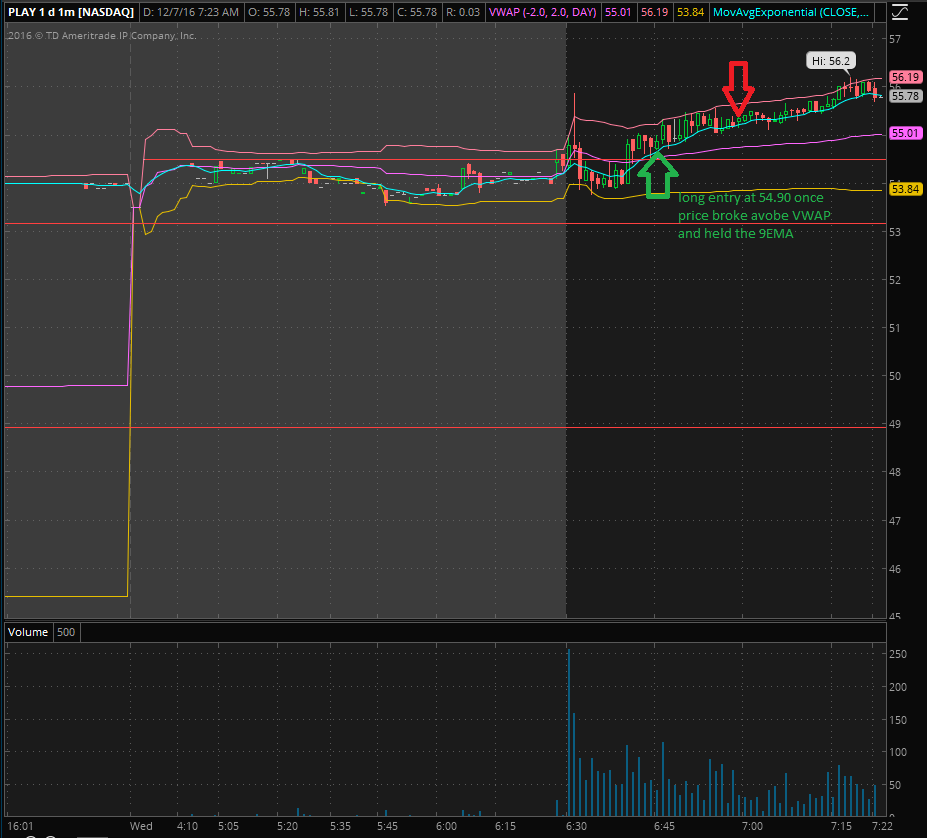
$PLAY from gap up scanner as well. Long entry at $54.90 risking on the 9EMA and exit at $55.50 once I thought I saw weakness. Nice and simple. If only every trade could be this headache-free. 


Thursday 12/8/16: $LULU also a gap up. I was initially looking for a long since the the 9EMA and VWAP were holding well, but I was patient and kept waiting for confirmation. Once that first candle printed under the 9EMA I got short at $70.22. Exit was at $69.15 near support. 


Monday, December 5, 2016

11/29/16-12/2/16 Recap

Tuesday 11/29/16: $X popped up on gap down scanner and I was looking to short under $31 which was premarket support but it broke through before the open and didnt take the trade since i dont like trading premarket. I decided to wait and see what sets up. Around 11 oclock the stock was uptrending nicely and broke above VWAP. Got in long at $30.91 with a tight stop right below the 9-day EMA. Saw resistance at $31.50 so got out at $31.40.


Wednesday 11/30/2016: $SPLK from gap up scanner. Big sell off right at the open so I made sure I didnt chase (as tempting as it was). Waited until stock came back up towards VWAP and got in short off the bounce at $60.31. It was consolidating for a bit at that $60 level and that kinda spooked me out so I got out pretty fast at $60.07. I kept my eyes on this and on the next move back up $60 confirmed as resistance so I got in short again at $59.84. Got out way too quick here at $59.50 but I'll happily take my piker profits lol. 


Thursday 12/01/16: $BLUE from gap up scanner. I had my eyes on this all day and when the short set up off the VWAP bounce I realized my broker didnt have any borrows and stock was not shortable. :( no trades this day.


Friday 12/02/16: $WDAY from gap down scanner. Was looking for a short to break under under $67.50 level. got in short at $67.67 and got stopped out at $68. I kept my eyes on this but I let my earlier trade affect my bias on this and I was still thinking short for some dumb reason instead of looking at what the chart was telling me. I should have taken this long around 11 oclock once VWAP and the 9EMA was holding and stock was uptrending. Im just glad I didnt push any other buttons for another short attempt here.


Things to keep in mind:
Look at where stock is at around 11 oclock once you have a whole half day of price action to go by
Missing out on a trade is better than a losing trade
Dont let earlier trades affect yout bias
Check to make sure broker has borrows before wasting time on a stock looking for a short 
General Rule- gap down, look for uptrend. gap up, look for downtrend. obviously this is just something to use as a guide. 

Monday, October 17, 2016

Interesting video related to Trading

At 3:40 he explains exactly how I attempt to approach the markets. Even if you only make money on half of the trades you take, as long as your using proper risk management to let your winners run and to cut your losers fast, then probability will be on your side. If you make 100 trades and every time you lose you only lose $10 and every time you win you make $20, even if you only have a 50% winning ratio, then the chances of you losing money at the end are 1 in 2300! Also funny to see how hesitant the people in the video are to take on any risk at all lol trading is definitely not for everyone 


Monday, November 2, 2015

Running a scan and finding a worthy setup

Night Scan

Finviz.com is what I use for scanning stocks for the next day. Their service is free and you can even create an account to save your scanner filters so you don't have to manually change them every time. I use 6 filters, which you can see in yellow in the pic below. But the two main things I'm looking at are circled in red and those are:

Stocks making a new 52 week-high
-These are of interest because the stocks are hitting the highest price they've hit all year. Meaning that no one who bought this in the past 365 days, and is still holding it, is down money on it. So one of two things will most likely happen here. The stock is guna  keep going higher because new buyers are guna step in and people who already own shares wont have an incentive to sell since they're already in the green. Or there is guna be profit taking causing a sell off and price is guna fade. Simple supply and demand rules. As a trader, I'm not trying to predict exactly which way price is headed. My job is to make a plan for all possible scenarios that could take place and then react to price action.

Stocks with relative volume over 1
-Relative volume over 1 means that they are trading an amount of shares that is at least as much as their average daily volume. These are stocks that are "in play" and that have a more than the usual amount of transactions taking place. The more volume usually means the more volatile a stock will be, giving you better opportunities for a trade.


After running the above scan on Wednesday night 10/28, I came up with a few results. The ticker $NHTC caught my attention the most because of its low float of 7 million shares (meaning a low amount of shares available for trading. Lower float = takes less volume to move its price) and because of its long term resistance at $45, which you can see in the daily chart below.


After liking the daily chart, I pulled up the intraday chart from Wednesday. $45 acted as resistance on this time frame as well, tapping it twice throughout the day, but never breaking through it. Its also important to note that on Wednesday the stock opened at around $38 and even after it ran all the way to $45 and faded off that point a little bit, it still had a pretty strong close at around $44 right at the VWAP. So knowing that it still had strength after  bouncing off that key level of resistance twice made me think that maybe there isn't going be a sell off and that the stock could def go higher. So I went into the next day a little bullish biased. but still prepared to short the stock off $45 if it happens to be that it cant break through it.


Below is the 5 minute intraday chart for the whole week. After scouting this stock on wednesday night, it setup perfectly on thursday morning. Right at the open you can see the stock is showing strength and blows past that $45 key level of resistance on the first few candles. Once it consolidates for a few minutes and $45 turned into support, it gave me a great low-risk entry opportunity. 


And then finally below is the daily chart after it made the move I was looking for. $NHTC was a perfect example of a clean setup right off the scan. These kind of plays have been the only ones I really feel comfortable trading since all the August/September volatility that happened, so its important I write about them to fully understand how they develop and hopefully become more discipline to sticking strictly to them.